

Your New Best Friend
Google Analytics is the bestest thing on Earth. When you’re a marketer (if you’re reading this, you probably are…), Google Analytics is your best friend.
For those unfamiliar, Google Analytics is a program which tracks activity on your website. Reading that back, it’s kind of like saying Jimi Hendrix was just a guitar player, or the Red Sox are just a baseball team. Google Analytics isn’t actually “just” anything. It’s so impressive, so important, that it may be able to save the world.
Assuming you’ve built and launched a fantastic website, it’s time to see if it’s actually working. Google Analytics will run in the background of your website (invisible to visitors), and track activity.
Here’re a few of the key questions that Google Analytics can answer:
- How many people are visiting my website?
- What pages are they looking at the most?
- Which band member is the most popular?
- What are fans interested in?
- How are fans finding out about the band?
The answers to any of those questions are able to propel your band forward and allow you to make informed decisions. If you know what fans are interested in, then you can do more of it. This is far better (and much less time consuming) than guessing. It’s also fairly indisputable: numbers don’t lie.
Here’s a peek inside Google Analytics:
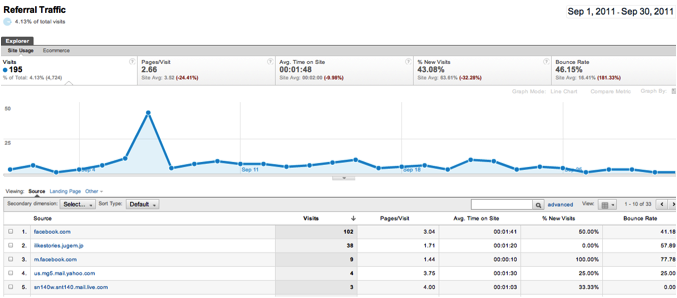

This is a basic overview of an artist’s website for the month of September 2011. We can see that he had 4,724 visitors of which 3,380 were unique – meaning they hadn’t visited the site any time in the last 30 days. Just over 63% of the visitors were new. How’d they find you? Here’s where it starts to get fun:
In this image, we’re looking at referral traffic – visits that were directed from other sites. We can see that Facebook sent (or “converted”) 102 fans, and that Facebook’s mobile site (fans using mobile phones/browsers) sent 9 fans.
In the month of September, we can deduce that 3% of traffic to the artist’s website came from Facebook. We got there with this math: 102 Facebook referrals / 3,380 unique visits = 3%).
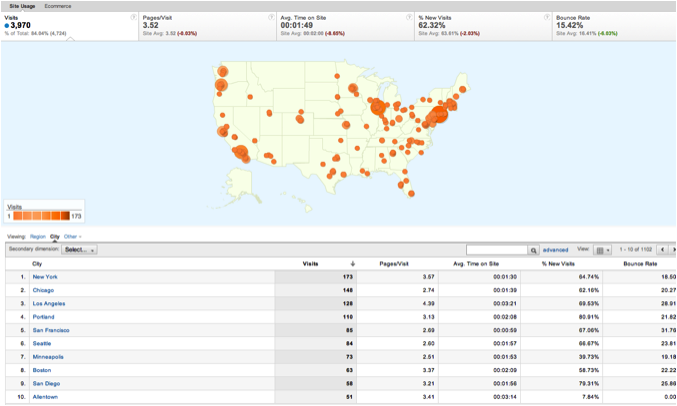
Here’s another example:
If you’re thinking about touring, wouldn’t it be nice to know where your fans are? In this example, support is very strong in the Northeast. Not surprising, but the #10 city is Allentown, PA! In a list of big cities, you think Chicago, NYC, Boston, etc. Does Allentown ever make the list? For this band, maybe it should…
You’ll also get statistics from Facebook, Twitter, and YouTube. But your website is all yours – nobody else is advertising on it, and nobody else has the ability to alter its content or design. As such, it makes sense for your website to be the “official source” for information about your band. It’s presenting you specifically how you wanted to be presented. In terms of understanding your audience, Google Analytics (only available for your website!) will give you more information about your fans than any other platform. The more you know about your fans, the easier it gets to provide them with the content they’re looking for.
For those of you using Bandcamp (as of Winter 2011), they do not allow you to properly embed their storefront onto your website. Thinking about your analytics, this becomes a bit of a problem. You end up competing with yourself.
Let’s suppose that your main goal is driving traffic to your website (so that people can learn about you, find out when your gigs are, and buy your music). You’ve got Google Analytics running, and you know exactly how your doing relative to your goal, right?
Wrong[1].
The second they click that “store” button, they’re whisked off to the country of Bandcampia. While your website is a proud American, your storefront still lives in its native country where (much like North Korea) certain statistics are given out and others are simply unattainable. Information is your greatest tool. It’s the John to your Paul and/or the Ringo that makes the whole thing work.
Years ago, I worked for a company that was moderately successful, but they didn’t know why. No previous marketing person had ever tried to either institute or provide quality statistical measurement. So I went through all the company’s sales going back roughly five years. I put together a breakdown of what type of sale, the cost, time of year, and a few other industry specific provisions. Then I sat down with the CEO and told him that I needed the reports on his sales for the last 5 years. While he had a strong sales team, the CEO still made roughly 30% of the company’s annual sales.
He turned me down cold. He didn’t want to share his numbers or his info because he felt it took away his competitive edge – against his own sales team!
Aside from the inherent trust/team issues this brought up, it made my report somewhat useless. Ultimately I had 100% of the info on 70% of the data. There was still 30% that remained in the great unknown. Incomplete data will always yield inconclusive results.
Here’s another way to imagine it: you’re doing something right, and thousands of people are visiting your website each month. But somehow sales are essentially non-existant. For all the traffic coming to your website, you’ve got no sales to show for it?
All this being said, Bandcamp does offer statistics for plays and placements on their platform, but while nice, they’re not as robust as what Google Analytics does for you. Keeping your entire stats “collection” in one place, amounts to higher quality of results obtained.
No Comments